Page 45 of 50

Re: Stock Market Discussion

Posted: Fri Mar 26, 2021 11:19 am
by cktbreaker
What's going on? Hope everyone is staying unemotional thru the volatility. I had to back off the trading for a bit, it was breaking me down, too much time in front of screens.
Longs should be good till VIX gets down around 14, then will be looking for more shorts. I went long some oil companies yesterday, hate it but I think that's where the money will be. MRO, VLO (which looks like a good long right now). Would like some MP but think i might have missed the entry on that one.

Here my daily NIO chart.
Image
I think 29 ish is probable, often price will go to the 4.618. Might do a trade at 29ish, but would be quik to take profits at the red wick and the bottom of the swing there then move the stop up into profit. You can see price rejected at 45.63 so nothing has been gained, until something is gained NIO should continue down. Same scenario from a few weeks back where it didn't gain 52.08 like we were talking about. I should add that if NIO can close a couple daily candles above 45.63 a long at 39.26 would make sense.

Re: Stock Market Discussion

Posted: Fri Mar 26, 2021 2:03 pm
by cktbreaker
RCL - Royal Caribbean short we were discussing few weeks backs working out nicely. Short 3 pt's, re-add to short at red line again 3 more pt's, it puts itself in the box.
Look at that second short entry to the penny 96.77
Image

Re: Stock Market Discussion

Posted: Fri Mar 26, 2021 2:12 pm
by cktbreaker
Mentioned I pick up a long on ATNF also few weeks back at 3.70 woke up today to three pt's. Low liquidity pop to the top side. Left a small runner that is looking a bit sad now. Red line is where it went to pre-market. My pt's were the blue lines so missed out on that high, as it was not a pt obviously. Nice trade though, buy 3.70 two pt's reload at the swing test and three more pt's pre market.
Image

Re: Stock Market Discussion

Posted: Sat Mar 27, 2021 7:48 pm
by bubbie
cktbreaker wrote:
Fri Mar 26, 2021 11:19 am
I went long some oil companies yesterday, hate it but I think that's where the money will be. MRO, VLO (which looks like a good long right now). Would like some MP but think i might have missed the entry on that one.
Vix is crazy high, indeed.

I am not entirely sold on oil, yet.

Not sure about VLO, but I looked at MRO a few days ago and thought it was back or close to pre-pandemic pricing, unless I am confusing it with something else. Not sure if there is much of a play there (to be fair, I have no idea what they did during the year after the crash).

Funny because I was looking at MP for a while now. Pretty sure it provided you with another opportunity to enter later in the day (there was quite a dump in the afternoon). Still not sure about it myself.

I am currently looking at REITs rather than oil. Purchased some BPY today, though I am not sure if it was a good move.

It seems that market overall is moving towards the boomer stocks.

cktbreaker wrote:
Fri Mar 26, 2021 11:19 am
Here my daily NIO chart.
Image
I think 29 ish is probable, often price will go to the 4.618. Might do a trade at 29ish, but would be quik to take profits at the red wick and the bottom of the swing there then move the stop up into profit. You can see price rejected at 45.63 so nothing has been gained, until something is gained NIO should continue down. Same scenario from a few weeks back where it didn't gain 52.08 like we were talking about. I should add that if NIO can close a couple daily candles above 45.63 a long at 39.26 would make sense.
I think NIO is going to tank for the time being. The news yesterday that they shut down their production for 5 days due to the chip shortage could not have come at a worse time either. Probably will end up being more than 5 days too. And probably more shut downs in the future because this chip issue isn’t going to be resolved that quickly.

That just goes on top of the fact that the charts look like fudge, really. The pattern I mentioned on the previous page is pretty much complete now and it is highly unlikely, in my opinion, that it will go up from here. Maybe a bounce, but downhill later. Volume has increased in the past couple of days, but it is still low in comparison.

Image

Probably easier to see the pattern on the line chart (if anyone is interested):

Image

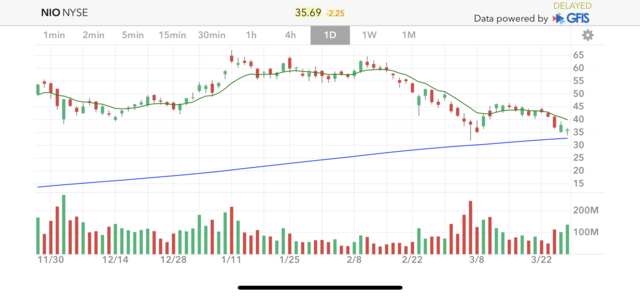
About the only “good” thing here for NIO is that the 200-day moving average should serve as a strong support. On the other hand, that 50-day MA (I think that’s what I have set up, I should check) is about to cross it and that’s where things will begin to fall apart further, perhaps. Daily chart:
Image

To me, there are at least two interesting things here about the volume. One I already mentioned: it is decreasing. The recent rise in volume suggests that selling is winning, so far. The second is that since about late December or early January, two consecutive green bars are followed by a sell off, without exception.

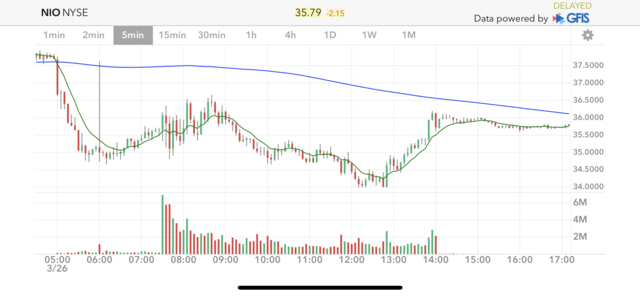
Checkout this 5-minute chart (just for convenience, to show yesterday’s trading):
Image

It includes outside market hours, as can be clearly seen. First thing we can see here is the low volume dump (the price dropped by about $2.50). At 6AM, when the next batch becomes able to trade, there is a desperate attempt to bring the price back up, they kind of close the gap, but come short and it ends up being another sell off. Then, at market open, the real volume comes in and all they can do is move the price up by about $0.7-0.8 within the next hour, which is followed by a decreased volume and a drop to the low of $34. Nothing exciting after that, in my opinion: the price bounces back quite a bit on low volume and the day ends with another little sale. The price stops short below the 200 MA.

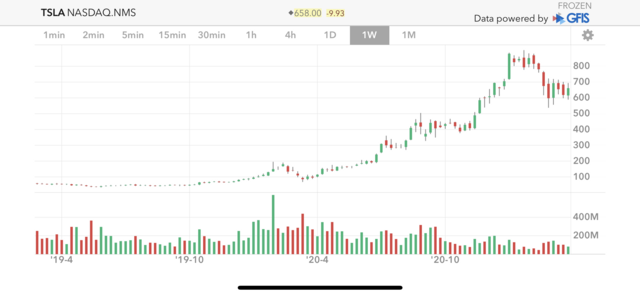
Also, I never really look at the Tesla chart because I do not have much interest in it, but I did take a quick look yesterday. The obvious thing here, again, is volume:

Image

There really isn’t that much interest in it compared to a year ago and it really started vanishing last September when the share price was in the $400’s range. That, along with other indicators, suggests to me it is going to head to that same range soon/eventually (soon would be my bet).

One other interesting thing I noticed when looking at the NIO chart a couple of days ago. Nothing interesting in regards to NIO in particular, but I thought an interesting illustration of the power of stop orders. This is a minute chart:

Image

It looks like there were a lot of sell orders set to activate in that $40.10-39.70 -ish range, where a fairly strong support/resistance is. It dropped the price by about $0.50 in a matter of seconds.

Re: Stock Market Discussion

Posted: Sat Mar 27, 2021 8:09 pm
by bubbie
bubbie wrote:
Thu Mar 11, 2021 10:28 pm
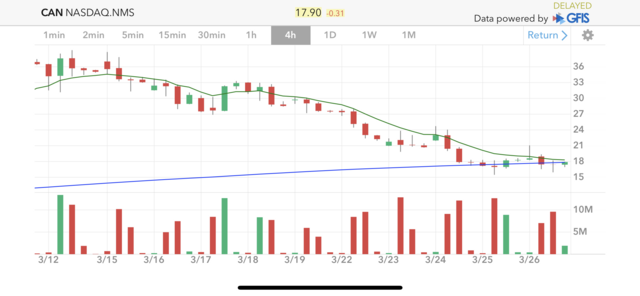
Also, CAN had an insane few days. That one will crash without a doubt. Options are expensive as drymount though and IV is crazy high.
This was sure and easy money. Not for me though because I thought the puts were too expensive, lol. And they were, I don’t remember how much exactly, but they were, so it was a fair point. High IV was also a legitimate concern. Nevertheless,

Image

I called it at the top on the 11th, when it closed above $39. It closed below $18 yesterday. That’s about $21 of intrinsic value alone, while there was only a few cents of it when I was looking at those $40 April puts on that day. And this ticker will keep rolling, most likely. Not sure what the option prices were yesterday, I didn’t look, but my guess is the current gain on those $40-strike puts is over $1K per (since the 11th). I’d probably sell yesterday, though I do think it will keep rolling (almost everything on that chart suggest this is the case, and so do the fundamentals and common sense), with a good chance going back to 5-6 bucks per share. I would have made somewhere between $10K and $15K, at least, with this move if I proceeded with common sense. Womp womp.

Edit: In reality, this is why I didn’t act on it, for the most part.

On March 1:
bubbie wrote:
Mon Mar 01, 2021 7:42 pm
Instead bought puts for CAN, which may have been a mistake, lol. We will see (March 19 puts).
On March 4:
bubbie wrote:
Thu Mar 04, 2021 2:26 pm
The only greens in my basket today are put options, lol: ... CAN (still a loss, but will recover, likely today) ...
I ended up selling those puts for a small profit, if I recall correctly, and I was fairly uncomfortable holding them. CAN had that crazy run-up just a few days later, which would make the puts I was holding obsolete. That’s when IV shot up and option prices skyrocketed.

Re: Stock Market Discussion

Posted: Mon Mar 29, 2021 1:20 am
by bubbie
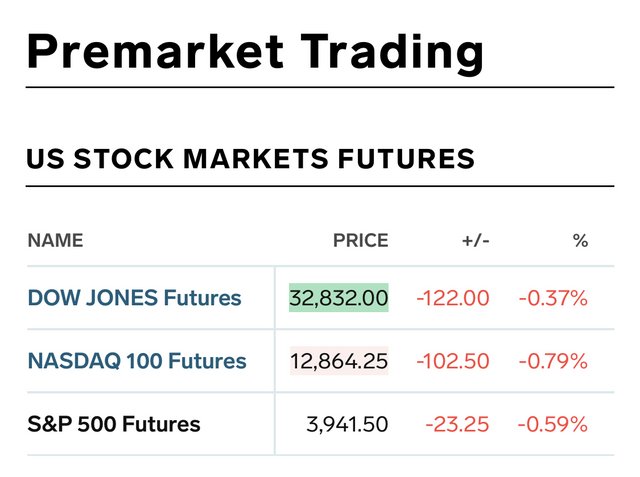
This is interesting. It appears, a hedge fund got liquidated on Friday.

Reuters: Large block trades that caused selling raises questions about cause

I saw some of those tickers tanking and was wondering what the drymount was happening. My guess was that they found more “fake” Chinese companies (I have some of them on my list).

I looked into it a bit over the weekend and here is a pretty solid explanation of what may have happened (and probably did), if anyone is interested: https://mobile.twitter.com/bauhiniacapi ... 6298718212

Interestingly, while running some searches I ran into this little page (GSX is one of the companies mentioned in the article):
GSX Techedu is a $24 Billion Fraud…enabled by their auditor

I wonder how many of the listed companies originating in Jina are one real audit away from going into nonexistence. There was a good doc about it on Netflix or Prime, about this same fudge but from a few years ago. Can’t recall the name at the moment.


On a separate note, nuclear may be a play at some point. I do have some companies on my watch list, but need to look into a little more.

Reuters: EU experts to say nuclear power qualifies for green investment label: document

Something else I wanted to post, but... I don’t remember. Likely no one cares anyway, lol.

Tomorrow is going to be a volatile day.

Image

I wonder if there is a way to take advantage of those tickers mentioned in the article. Surely they were oversold. Need to take a look at the volume and charts in general.

Re: Stock Market Discussion

Posted: Tue Mar 30, 2021 10:51 am
by cktbreaker
Bubbie, you bought resistance. Look at this BPY weekly. Are you break out trading with CNBC?
Image

Re: Stock Market Discussion

Posted: Tue Mar 30, 2021 12:49 pm
by Codeblue
Luls.

Re: Stock Market Discussion

Posted: Wed Mar 31, 2021 12:22 am
by bubbie
cktbreaker wrote:
Tue Mar 30, 2021 10:51 am
Are you break out trading with CNBC?
Lol (actually laughed).

Yes, I know. That’s why I said I wasn’t sure it was a good move, lol. We will see. I have a stop set just in case. There was also a little gap on the way up to be potentially filled from not too long ago. We shall see.

Also, it was a BPY.UN at Toronto Stock Exchange, but it’s the same thing, really, chart wise.

Re: Stock Market Discussion

Posted: Wed Mar 31, 2021 8:30 pm
by cktbreaker
Well Bubbie, I seriously hope it works for you, i do. I'm gonna break this all down. The issue with buying high at strong resistance is where to put a SL, there is no support anywhere in the area so the chances are high that a position like that will get stopped or retail doesn't use a stop loss thinking they will DCA (dollar cost avg) their position until they freak out and sell at an even bigger loss into the big guys shorts or the retail trader and their other retail friends say don't worry it's a good stock it will come back someday and most will bail as soon as they get back to break even. But leaving your money in something for what could be years until the stock comes back is just a free loan to that company. And remember as you DCA it's FIFO (first in first out) so either you sell your whole position the second you get to break even or you have to wait until the price goes above your initial entry to make money. You hear this kind of thinking big time in crypto where people bought btc at 20k because moon, held and now are thinking they were smart hodling but in fact they are just lucky and have had their money tied up for years. So the big guys are shorting the resistance and using break out traders stop losses to fill their big positions. Same with moving averages, its just an average not a level and doesn't offer a good place for a stop loss. All the big traders are trading price action and using algo's based on price action. They use things like support and resistance and moving averages as profit targets, they count on 'retail traders' watching moving averages as their liquidity to fill their buys and sells. They need that liquidity because their buys and sells are large, they need a bunch of little guys to sell so they get filled. They also know that retail traders are watching the news. News is only an accelerator of the move. They already have their positions well before 'retail' hears the news, those retail buys and sells are right into their profit targets. So the idea is to trade with them and pick up the crumbs, because we can't beat them and we don't have the money. They also know that retail fomo's and retail is full of emotion which further increases their advantage. In addition they know retail doesn't understand how to read price action, so when we get a bit further along we look at patterns, they know you see the head and shoulders or the ascending/descending triangle or whatever pattern you can think up, because it's obvious and again they will use retail as their liquidity. Volume trading, same thing what makes the volume candle grow? Massive amounts of people doing the same thing, which by the time you see volume the move is well underway and so often people see a big red candle and sell often at the bottom, then you'll hear "i sold and the thing reversed on me" or "the thing was pumping I bought and the thing reversed on me" over and over and over again. All this is why so many traders (going back to our discussion about trading vs long term holding of a fund) fail to achieve in the markets. Now you can say I am full of fudge and I am sure people will do just that. It happened when I tried to tell some of the GME crowd what was happening they said F your stop loss, stops are for losers, but that's because they don't buy in the right spots and their stops get run and then they give up on stop losses and then they are broke and quit the game.

Sorry if some of that is convoluted.

So as an example of fomo and the retail mindset. For some reason I had Cramer on while typing this post, he gets a question about Hylion HYLN. I bought HYLN this morning at $10.24 and have already taken a profit target and moved my stop to break even. Jim says it's great and a buy (but doesn't tell them where to buy) I look at price and it starts climbing right after he says it. I say thank you retailers and type in a limit order real quick and get another pt just because they are buying (I am a retailer too) but where if they use a stop will it be? It should be below support but they are in the middle of the move, if they get lucky the stock will go up and they will feel smart and thank Jim, but in fact they are being used to push my and others positions that bought low.

OK i'll stop here otherwise tl/dr....which is fine it's your money to do with as you wish.

Re: Stock Market Discussion

Posted: Thu Apr 01, 2021 2:17 am
by bubbie
Good post. A few things to note from my perspective.

cktbreaker wrote:
Wed Mar 31, 2021 8:30 pm
Well Bubbie, I seriously hope it works for you, i do.
Thanks :) I have my doubts, lol. The move wasn’t to make a ton, though. Rather to put it somewhere for the time being that has a bit of potential and pays hefty dividends. I don’t have time currently and won’t have for next while to do much “active” trading. If it stops out and I lose a little, then so be it.

cktbreaker wrote:
Wed Mar 31, 2021 8:30 pm
The issue with buying high at strong resistance is where to put a SL, there is no support anywhere in the area so the chances are high that a position like that will get stopped
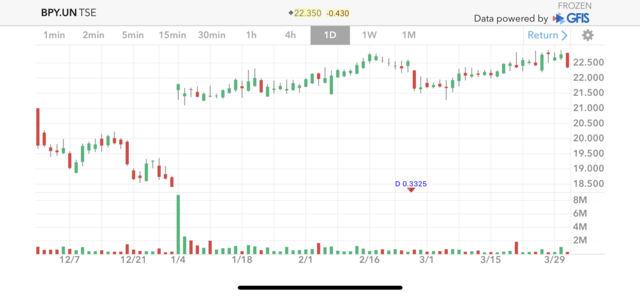
But there is support in the area. And you probably saw that when you looked at the daily or 4-hour charts.

Image

Image

It isn’t as strong of a support, but it is there. You can see it was last tested about three weeks ago. For a 22-dollar stock, there is quite a swing there to play with.

cktbreaker wrote:
Wed Mar 31, 2021 8:30 pm
retail doesn't use a stop loss thinking they will DCA (dollar cost avg) their position
I, personally, don’t or rarely “implement” the averaging down strategy. I am usually out of the position by the time one would average down. Even if I am not, I feel like I drymounted up and usually do not see any reason to further increase my position to bring down the cost. It ties up the funds. But many do and that’s OK. I simply don’t like having my allocated funds tied up in the long-term hold. But fudge happens.

Also, ask Cathy Wood, lol.

cktbreaker wrote:
Wed Mar 31, 2021 8:30 pm
Same with moving averages, its just an average not a level and doesn't offer a good place for a stop loss.
While it isn’t a place to put your stop order at, it is a good place where to expect a support or resistance. It is simply just one more tool to use (or at least be aware of) in building a strategy and expectations of what might happen to the price as it approaches an average. Also, historically, things did occur more often than not when certain events happened, like one average crossing another. At the very least, one can take note.

cktbreaker wrote:
Wed Mar 31, 2021 8:30 pm
so when we get a bit further along we look at patterns, they know you see the head and shoulders or the ascending/descending triangle or whatever pattern you can think up, because it's obvious and again they will use retail as their liquidity. Volume trading, same thing what makes the volume candle grow? Massive amounts of people doing the same thing, which by the time you see volume the move is well underway and so often people see a big red candle and sell often at the bottom
Patterns, like head and shoulders and others, are important because, again, one should build their expectations accordingly when they see certain patterns take form because historically certain trends are likely to follow. Once the head and shoulders forms, for example, isn’t there like 80 or even 90% chance that fudge is about to hit the fan? The answer is yes. That pattern indicates, and does so strongly, that the underlying major support will fail at least 80% of the time and further significant drop in price should be anticipated. For me it often means making sure I have enough funds available, maybe exiting some other positions, to enter a short, etc.

As for the volume, in my opinion, volume is one of the most important things, if not the most important (probably is). I generally wouldn’t care if a main resistance is defeated with only a few shares exchanging hands. And why would I? That simply means the breakout would likely not hold and I would likely be stopped out the next day or the day after if I decide to enter the position. Like you said, volume means that everyone is doing the same thing, meaning the opposite is true. You also said that the big boys sell in big numbers; they buy in big numbers as well. I don’t often act on volume as I see it (as in live action, which there isn’t because of the delays) because that move is likely behind. Like you also said, we are only privileged to information after the big boys already took advantage of it. However, volume indicates quite strongly if the beaten resistance will serve as a strong support tomorrow and how likely your stop loss order to be executed. In fact, from my perspective (depending on other factors), if there is an all of a sudden break out with no significant volume, there will likely be a good short opportunity in the very near future.

Having said that, to buy something midday and sell it before the close or shortly after, I would not be particularly concerned about the volume.

cktbreaker wrote:
Wed Mar 31, 2021 8:30 pm
Now you can say I am full of fudge and I am sure people will do just that. It happened when I tried to tell some of the GME crowd what was happening
Lol. You can’t come to a church and tell everybody they believe in a fairy tale. What did you expect? I have been told the same by the AMC folks, lol.

cktbreaker wrote:
Wed Mar 31, 2021 8:30 pm
So as an example of fomo and the retail mindset. For some reason I had Cramer on while typing this post, he gets a question about Hylion HYLN. I bought HYLN this morning at $10.24 and have already taken a profit target and moved my stop to break even. Jim says it's great and a buy (but doesn't tell them where to buy) I look at price and it starts climbing right after he says it.
I would assume that the folks who are buying are buying for a “long hold”, so it doesn’t matter to them. I mean I doubt there is anyone watching Cramer (or anyone else alike) while day trading.

I haven’t had cable in years, so I don’t get to hear what these guys say, except for some of their quotes in articles I may run into.

Re: Stock Market Discussion

Posted: Thu Apr 01, 2021 7:22 am
by mr_rugby
NIO delivered 7,257 vehicles in March 2021, increasing by 373% year-over-year

NIO delivered 20,060 vehicles in the three months ended March 2021, increasing by 423% year-over-year

Cumulative deliveries of the ES8, ES6 and EC6 as of March 31, 2021 reached 95,701

Up close to 6% premarket.

“So? So let’s dance!”

Re: Stock Market Discussion

Posted: Fri Apr 02, 2021 1:48 am
by bubbie
^ Solid growth.

I ran into an article at Reuters earlier today. Here are a few quotes and respective price charts (note that these are only US sales):

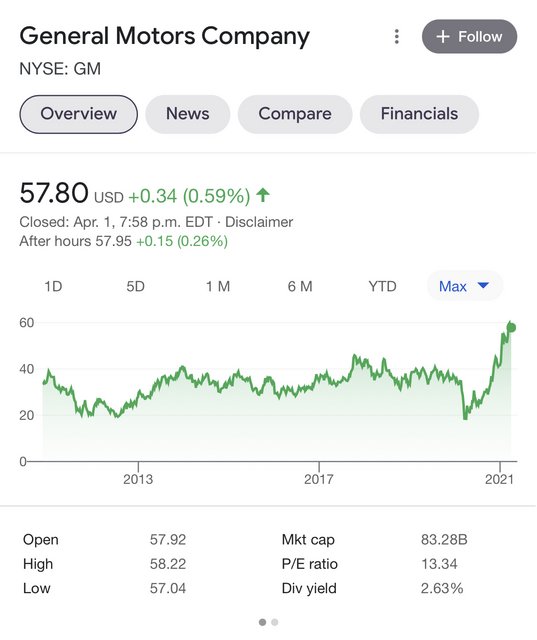
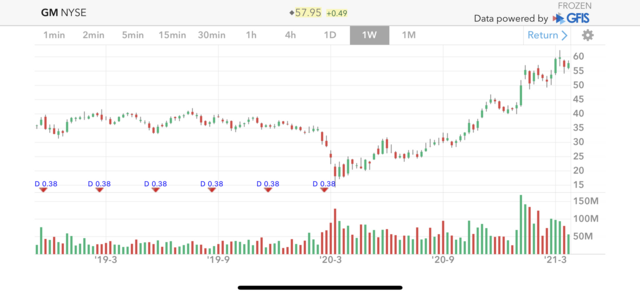
General Motors Co said its first-quarter U.S. sales rose 4% to 642,250 vehicles, helped by increased demand for its Escalade sport utility vehicles and Encore subcompact crossover SUVs.

“We are operating our truck and full-size SUV plants at full capacity and we plan to recover lost car and crossover production in the second half of the year,” GM Executive Vice President Steve Carlisle said.

The No.1 U.S. automaker said it expects the country’s auto demand to remain “strong” through the year, with rising consumer confidence and spending, aided by stimulus payments, higher vaccination rates and the reopening of the economy.


Image

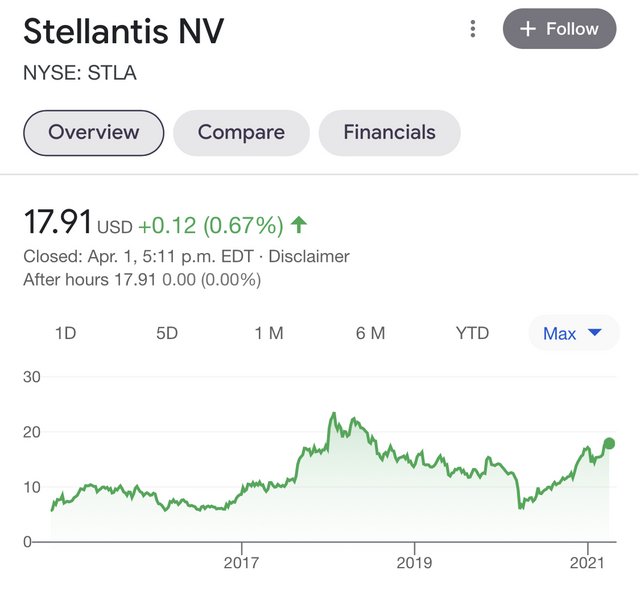
Fiat Chrysler’s U.S. arm said first-quarter sales rose 5% to 469,651 vehicles, due to higher Jeep SUVs and Ram pickup trucks demand. Fiat Chrysler is a unit of Stellantis NV.

Image

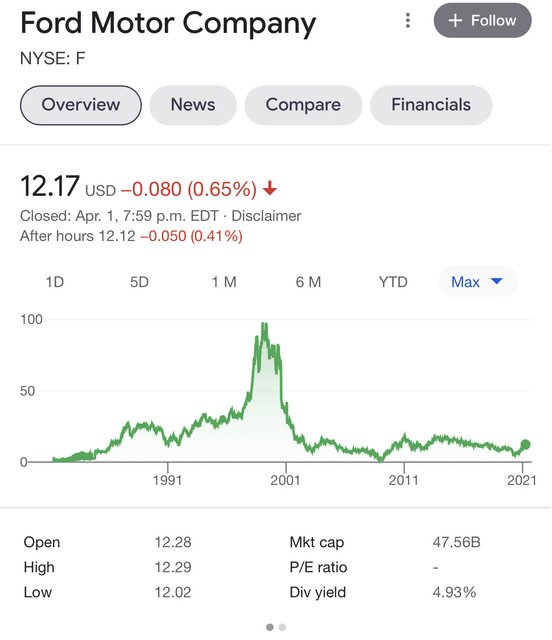
Ford’s quarterly U.S. vehicles sales were up 1% at 521,334 vehicles, with retail sales rising 23%.

Image


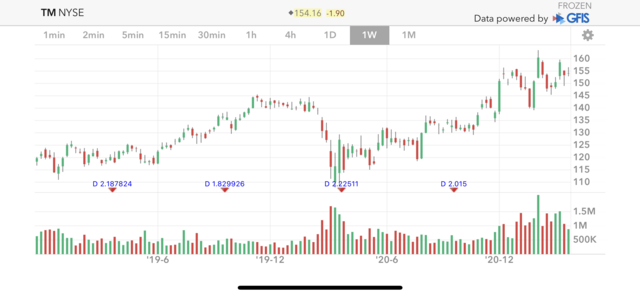
Japan’s Toyota Motor said its U.S. sales jumped nearly 22% to 603,066 vehicles in the quarter

Image

while South Korea’s Hyundai Motor’s U.S. sales surged about 28% to 167,130 vehicles.

Image

Closing price equivalent to 207.17 USD.

Other interesting insights from the article:

Higher demand and tight supply has allowed automakers to raise prices in the United States, with average price of a new vehicle reaching $37,314 in the first quarter, up nearly $3,000 from a year earlier and over $4,000 higher than 2019, auto consultancies J.D. Power and LMC Automotive said.

GM said it set a first-quarter record with average transaction prices at $40,353. The company estimates that the seasonally adjusted annual sales pace for the first quarter of the year was around 16.7 million units.


And then there is Tesla and Nio:

Image

Image

Just something to keep in mind, imo.

Re: Stock Market Discussion

Posted: Fri Apr 02, 2021 2:23 am
by bubbie
To add to my post from yesterday, why volume is important. Look at the GM, Ford, and Toyota volume (not the numbers, but the bars and trends as they relate to the price movement):

Image

Image

Image

Notice how not much is going on when there is no volume. Once the volume comes in, things start moving one way or the other, which is especially evident on GM and Ford charts above.

For comparison, here are the Tesla and Nio charts for the same time intervals:

Image

Image

There is a lot of pressure to sell on both of the above, imo. More so on NIO. You need volume and lots of it to make things move to where it counts.

I am not sure what stage we are in, but both of the charts just above will eventually look similar to that of Ford in my previous post. I could very well be wrong, but I don’t have much doubt in my mind about it. That is,

Image

Edit the next day: Tesla released the numbers today:

The electric-car maker delivered 184,800 vehicles globally during the first quarter, above estimates of 177,822 vehicles, according to Refinitiv data.

This also exceeds its previous record of 180,570 achieved last quarter.

Tesla delivered 2,020 Model S/Xs in the first quarter, compared with 18,920 in the preceding quarter, ahead of model refreshes.

Re: Stock Market Discussion

Posted: Tue Apr 06, 2021 10:01 pm
by cktbreaker
Is this a head and shoulders pattern on the MES here? Image